Presence, attention, and inferred people in the signal field.
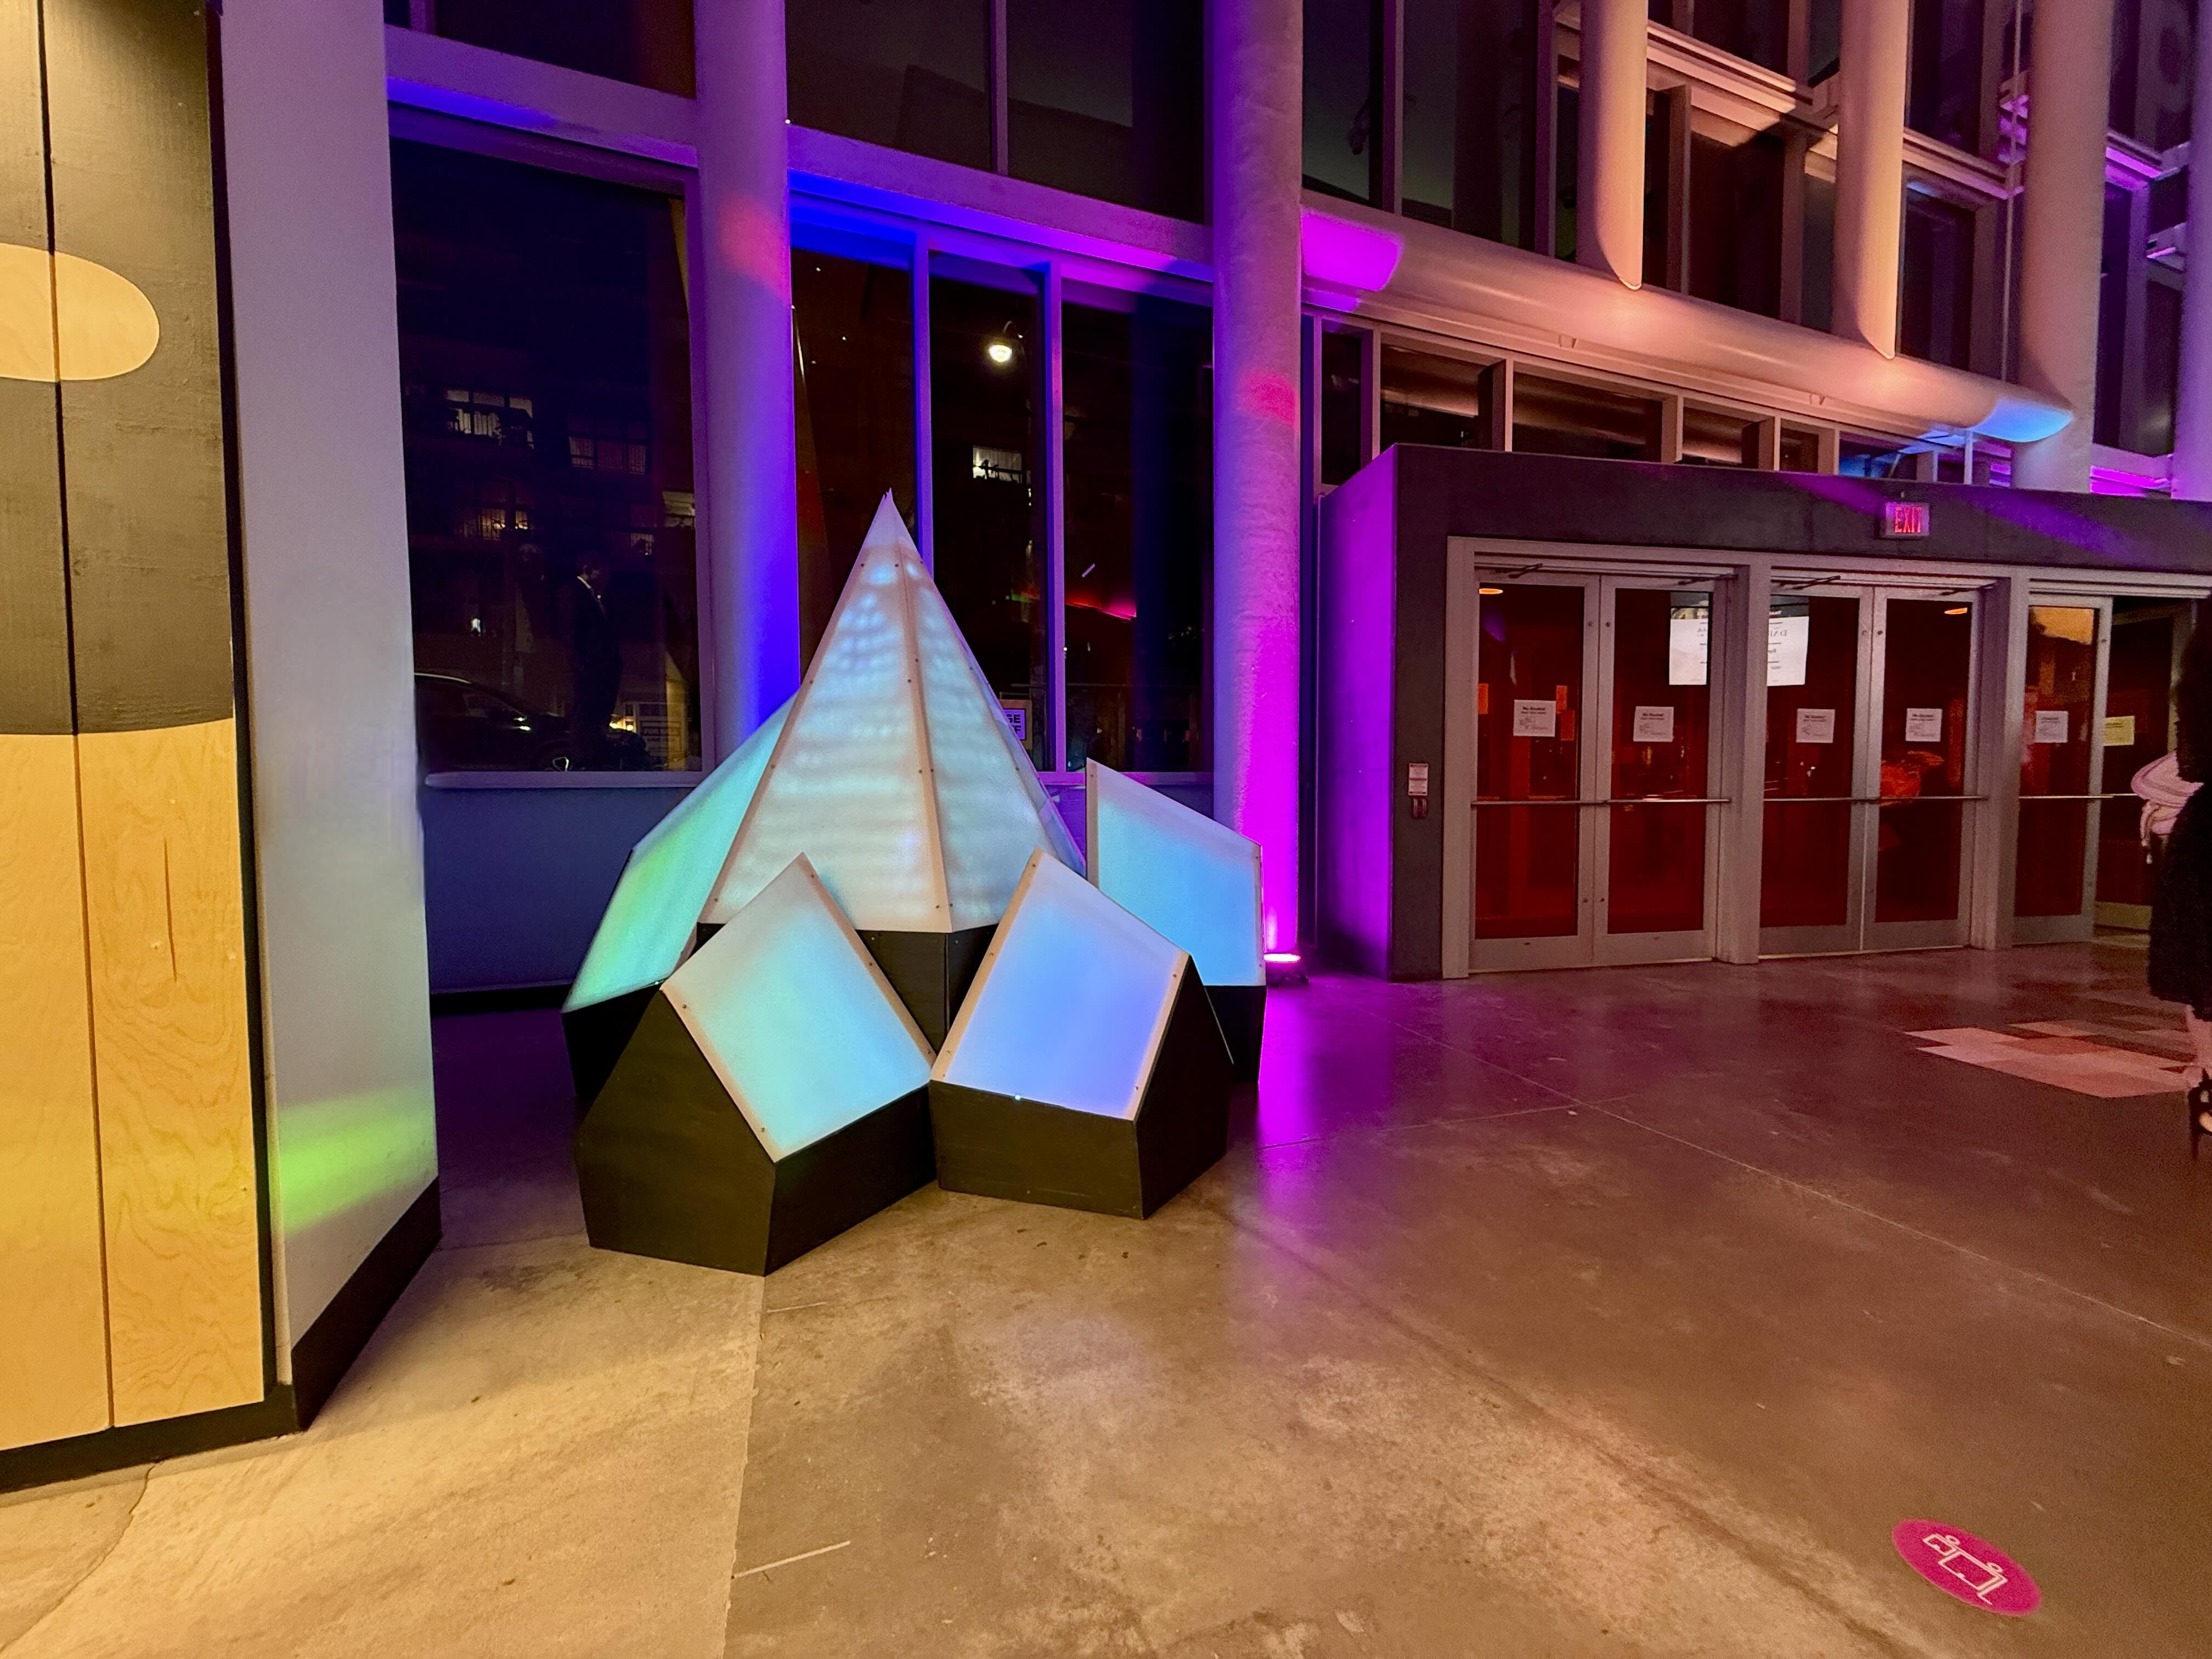
Six illuminated peaks form a small mountain range. Faceted planes of white acrylic, dark wood, and steel hold their geometry through the day; at night the forms glow from within, slow aurora gradients moving across the surfaces. This page reads the installation through that same lens: not as raw data first, but as a way of understanding presence, nearness, and collective atmosphere around the work.
Constellation Range listens to the ambient signals already moving through a space. Phones, watches, and earbuds continuously emit faint Bluetooth broadcasts; here those invisible transmissions become a way to sense how the installation was inhabited over time. The result is not a census, but a portrait of presence around the artwork.
1. The installation listens
Nearby devices give off a constant low-level broadcast. The work’s sensing layer notices when those signals enter its range, allowing the installation to register bodies in space without asking anything of them.
2. Presence becomes proximity
By reading how long a signal remained and how strong it was, we can roughly distinguish a passing glance from a closer encounter, and peripheral traffic from a more concentrated zone of attention.
3. Interpretation stays approximate
Because one person may carry more than one device, the people view remains interpretive. It offers a rough sense of how many people were represented in the installation’s field, rather than a literal count.
Installation Documentation
Constellation Range installed on site during the gala. The illuminated peak forms sit near the window line, which helps explain why the sensed field likely included both in-room viewers and some passersby outside looking in.
Quick Read
Key Read
How the Work Was Inhabited Over Time
This chart follows the installation through the night: how broad the surrounding field was, how much of that field gathered more meaningfully around the work, and how many signals moved into the strongest zone of attention.
Unique devices
Engaged devices
Active engaged
Qualities of Presence
A simplified reading of how the installation was encountered: passing, nearby, concentrated, and close.
Duration in the Field
These numbers suggest how long people tended to remain within the installation’s detectable atmosphere. They are best read as a rhythm of brief encounters and longer holds, not as exact viewing time.
Nearness to the Installation
Signal strength is used here only as a rough clue about nearness. Stronger signals usually suggest closeness to the peaks; weaker ones more often indicate distance, edge-of-room presence, or people outside the main viewing zone.
Farther edge
Edge of field
Mid field
Near field
Closest band
Rough Distance Read
These are broad, directional ranges rather than exact measurements. Glass, bodies, walls, reflections, and different phones all shape how the installation reads the space around it.
−56 to −51 dBm
Very close. This is the strongest “right near the work” band, often roughly within about 1 to 3 metres of the peaks.
−60 to −57 dBm
Close presence. A good proxy for people in the installation’s immediate orbit, roughly around 2 to 5 metres away.
−63 to −61 dBm
Mid field. Likely nearby in-room presence or viewers a bit farther back, roughly around 4 to 8 metres.
−66 to −64 dBm
Edge-of-field presence. This can include people farther from the work or on the edge of the room, roughly around 7 to 12 metres.
≤ −67 dBm
Weak fringe detections. These are the best candidates for passersby, window bleed, or peripheral presence beyond the main viewing zone.
Important caveat
Read this dashboard as a portrait of presence around the artwork, from close viewers to peripheral passersby, not as a literal attendance count.
Night Rhythm
Use this to map the installation’s rhythm across the night: quieter setup conditions earlier on, dinner presence, afterparty rebound, and late-night taper.